Lean Startup in the AI era: how agents can drive project methodologies
I read The Lean Startup in 2026, 15 years after publication. What I found was a framework that fits perfectly with AI agents and mcp-graph as an execution guardrail.
Table of Contents
I was in the bathroom when I had the insight.
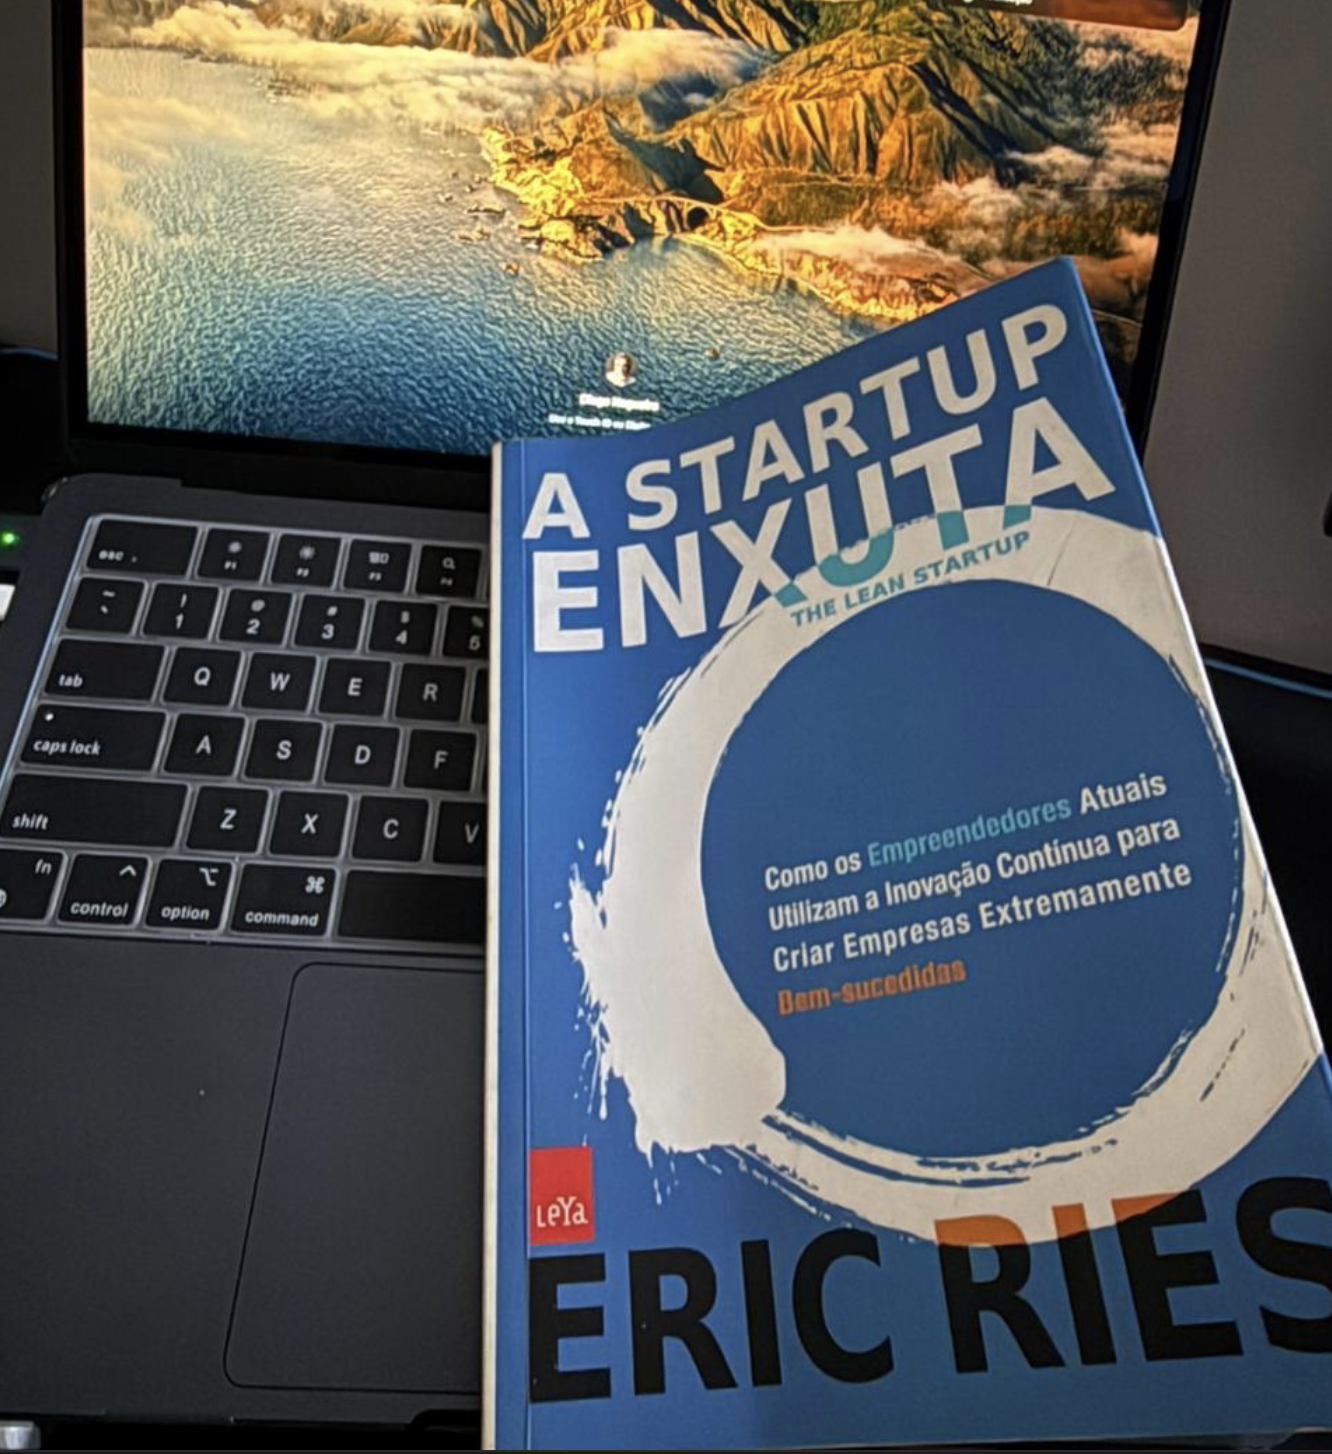
Not the most glamorous origin for an idea, but it’s honest. My best thoughts tend to show up at the most random moments, and that was one of those. I had just finished reading “The Lean Startup” by Eric Ries, a book published in 2011 (yes, fifteen years ago), and suddenly my brain connected two worlds I hadn’t realized fit together: classic project management methodologies with what I’ve been building in mcp-graph.
The question that stopped me was simple: if Build-Measure-Learn works so well as a decision framework, why isn’t anyone using AI to drive that cycle automatically inside a software project?
And the answer was equally simple: because most people treat AI as a code generator, not as a methodology executor.
The book that changed startup management (and remains relevant)
If you’ve never read “The Lean Startup,” here’s the summary I wish someone had given me earlier. Eric Ries published the book in 2011, and it became required reading in entrepreneurship, product management, and innovation. The central thesis is straightforward: most projects fail not because of lack of technology, but because they build something nobody wants. The solution is to stop guessing what the market needs and start testing hypotheses scientifically.
The book presents an arsenal of concepts that became part of every serious manager’s vocabulary. I’ll explain the main ones because they’re the foundation for everything that comes next.
Build-Measure-Learn
This is the central cycle behind everything. The idea is simple: instead of spending months building a perfect product, you build the minimum version, measure how users react, learn from the data, and go back to the start of the cycle. Each iteration reduces uncertainty. Each cycle brings you closer to (or further from, and that’s also valuable information) what the market actually needs.
If you’re not a developer: Think of the cycle like a scientist testing a hypothesis. They don’t write the entire thesis before running the experiment. They formulate, test, analyze, and adjust. It’s the same principle applied to products.
MVP (Minimum Viable Product)
The MVP is not “the cheapest product possible.” It’s the fastest experiment that allows you to validate a hypothesis with real data. Ries is emphatic about this: the MVP exists to learn, not to impress. If you can validate your hypothesis with a landing page and a form, that’s an MVP. No backend needed, no app needed, nothing beyond the minimum required to generate validated learning.
Validated Learning
This is the most underrated concept in the book. Validated learning is not “we think users liked it.” It’s “we have data proving that users behaved in manner X when presented with Y.” The difference between the two is the difference between opinion and science. And it’s exactly where most projects stumble: they make decisions based on feeling, not evidence.
Pivot or Persevere
A pivot is a structural change in strategy without changing the vision. Ries identifies several types: zoom-in (focus on a specific feature), zoom-out (broaden the scope), customer segment pivot (change the target audience). The decision to pivot or persevere is the hardest one a manager faces, and the book argues it should be based on data from the Build-Measure-Learn cycle, not intuition.
Innovation Accounting
How do you measure progress on a project where the final product doesn’t exist yet? Ries proposes three phases: establish a baseline (where are we today), tune the engine (improve metrics incrementally), and decide to pivot or persevere. It’s a measurement framework that replaces traditional metrics (“we delivered X features”) with learning metrics (“we validated X hypotheses”).
Five Whys
Simple and powerful technique: when something goes wrong, ask “why?” five times. Each answer goes deeper into the root cause. The production bug didn’t happen “because the deploy failed.” It happened because the test didn’t cover the scenario, because the requirement was ambiguous, because the discovery process didn’t capture the edge case. The Five Whys turn symptoms into diagnoses.
Vanity Metrics vs Actionable Metrics
Vanity metrics make you feel good but don’t inform decisions. “We had 10,000 visits” is vanity. “3% of visits converted to signups, and of those, 40% completed onboarding” is an actionable metric. Ries insists that the only metric that matters is one that changes your behavior when the number changes.
Small Batches
The smaller the batch, the faster the feedback. Ries uses the classic example of folding letters and putting them in envelopes: doing one at a time (small batch) is faster than folding all letters, then putting them all in envelopes. It seems counterintuitive, but small batches reduce total time and allow detecting errors earlier.
Reading a 2011 book in 2026: the turning point
I could have read this book in 2012, when everyone was reading it. But I read it in 2026, and honestly? I think it was better this way.
When you read a classic book 15 years after publication, you can see something that people who read it at the time couldn’t: which ideas survived the test of time. In the case of Lean Startup, almost all of them survived. Build-Measure-Learn remains the best way to reduce uncertainty in projects. The MVP concept continues to be ignored by companies that spend millions on products nobody asked for. The Five Whys remain more useful than any root cause analysis tool invented since.
But the turning point for me wasn’t the book itself. It was realizing that these concepts, these methodologies tested and proven over fifteen years, can be operationalized by AI agents. Not as a theoretical exercise. As real infrastructure for project execution.
Most companies I know have two recurring problems:
-
They know the theory but don’t execute. Everyone has read about MVP and Build-Measure-Learn. Almost nobody actually implements them. The cycle degenerates into endless meetings where “let’s test” becomes “let’s discuss for three sprints what to test.”
-
They use AI without a framework. They throw a PRD into the agent’s chat, receive a disconnected list of tasks, and call it “planning with AI.” It’s vibe coding applied to project management. No structure, no traceability, no decision criteria.
What I connected in the bathroom was: what if we combine the two? The discipline of Lean Startup with the execution capability of agentic AI?
AI agents as methodology executors
When most people think about “AI at work,” they imagine a chatbot answering questions or generating code. That’s the most basic level. What I’m proposing is different: using AI agents as executors of management frameworks, with the methodology embedded in the execution infrastructure itself.
Think about it this way. The Build-Measure-Learn cycle has three clear stages and a decision at the end (pivot or persevere). Each stage has inputs, outputs, and success criteria. That’s a graph. A structured flow with dependencies, checkpoints, and metrics. And graphs are exactly what AI agents know how to navigate when they have the right infrastructure.
The problem is that without this infrastructure, the agent treats each task as an island. It doesn’t know that the “implement feature X” task depends on the validation of “test hypothesis Y.” It doesn’t know that the acceptance criteria for the feature are tied to an actionable metric. It doesn’t know that if the metric doesn’t hit, the project needs to pivot, not keep implementing.
This is why generic AI tools fail at project management. They don’t understand methodology. They understand tasks.
mcp-graph as a project guardrail
This is where mcp-graph comes in. And where the bathroom insight becomes code.
mcp-graph transforms requirement documents (PRDs, specs, briefings) into persistent execution graphs. Not task lists. Graphs, with 9 node types: epics, tasks, subtasks, requirements, constraints, milestones, acceptance criteria, risks, and decisions. Each node has explicit dependencies, calculated priorities, and traceability back to the original requirement.
When you map Lean Startup into mcp-graph, the result is powerful:
Build-Measure-Learn in the graph
Each BML cycle becomes a subgraph with three phases and a decision point. The Build phase has its implementation tasks. The Measure phase has data collection and analysis tasks. The Learn phase has acceptance criteria that determine whether the hypothesis was validated or refuted. The decision point (pivot/persevere) is a “decision” type node that depends on the results from the Learn phase.
The agent doesn’t need you to explain the framework every session. The framework is in the graph. Persistent. Navigable. Traceable.
MVP as a trackable milestone
In mcp-graph, the MVP becomes a milestone with explicit acceptance criteria tied to actionable metrics (not vanity ones). The agent knows it can’t mark the milestone as complete until the criteria are validated. It doesn’t matter if all features are implemented when the conversion metric hasn’t hit the target.
Pivot detectable by graph metrics
When tasks start failing in cascade, when dependencies break, when the milestone’s acceptance criteria aren’t met, the graph signals it. The agent can analyze the failure pattern and suggest: “the data indicates that hypothesis X was refuted. Consider a zoom-in pivot, focusing on feature Y which showed better performance.”
This isn’t fiction. It’s graph analysis applied to project management.
Automated Five Whys
When something fails in the graph, the agent can trace the dependency chain backwards, asking “why?” at each level. The production bug came from a poorly specified task, which came from an ambiguous requirement, which came from a generic acceptance criterion. The Five Whys become a graph traversal.
Practical example
Imagine you’re validating a new notification feature for an app. In mcp-graph, the structure would look like this:
Epic: Validate notification system
  ├── Milestone: Notification MVP (Build)
  │   ├── Task: Implement basic push notification
  │   ├── Task: Create preferences UI
  │   └── Constraint: Maximum 2 weeks of development
  │
  ├── Milestone: Engagement metrics (Measure)
  │   ├── Task: Set up open rate tracking
  │   ├── Task: Implement A/B test (push vs email)
  │   └── Acceptance Criteria: Open rate > 15%
  │
  ├── Milestone: Analysis and decision (Learn)
  │   ├── Task: Analyze A/B test data
  │   ├── Task: Interview 5 users from test group
  │   └── Decision: Pivot or persevere
  │       ├── If rate > 15%: Persevere, scale notifications
  │       └── If rate < 15%: Zoom-in pivot to email only
  │
  └── Risk: Users may disable notifications at OS level
The agent navigates this graph, executes tasks in the correct order, respects dependencies, and flags when decision criteria need to be evaluated. The methodology isn’t in the manager’s head. It’s in the infrastructure.
The real value for project leaders
If you’re an executive, manager, or technical lead, you’re probably wondering: “cool, but what does this actually change in my day to day?”
It changes three fundamental things:
1. Real visibility, not management theater
Most project tools show boards with colored cards that give a sense of progress. But cards moving from “To Do” to “Done” don’t mean the project is heading in the right direction. In mcp-graph, progress is measured by the graph: hypotheses validated, acceptance criteria met, decisions made based on data. You see what actually matters, not what looks like it matters.
2. Data-driven decisions from the graph
When the manager asks “should we pivot?”, the answer today is usually a two-hour discussion based on opinions. With the graph, the answer is: “the last three BML cycles refuted hypothesis A. The milestone acceptance criteria were met at 23% (below the 60% threshold). The dependency analysis suggests that a zoom-in pivot to feature Y has 70% less risk than continuing on the current path.”
That’s not opinion. That’s execution data.
3. Complete traceability
Every decision, every pivot, every implemented feature is traced back to the original requirement. When the board asks “why did we change strategy?”, you don’t need to reconstruct from memory. The graph shows the path: from the initial hypothesis, through the collected data, to the decision to pivot. Project auditing becomes a graph query, not email and meeting notes archaeology.
| Without AI guardrail | With mcp-graph + Lean Startup |
|---|---|
| PRD becomes a loose task list | PRD becomes a structured graph with dependencies |
| Each agent session starts from zero | Persistent context in the graph (70-85% token savings) |
| “Progress” = cards moving on the board | Progress = hypotheses validated + criteria met |
| Pivot decision based on feeling | Decision based on graph metrics |
| Five Whys done in post-mortem (too late) | Automated Five Whys via dependency traversal |
| Vanity metrics (“we delivered 12 features”) | Actionable metrics (“we validated 3 of 5 hypotheses”) |
The future: why not turn abstract methodologies into deterministic code?
That’s the question that sums up everything I’m proposing. And the answer is: there’s no reason not to. We just lacked the infrastructure.
Today, methodologies like Lean Startup, Scrum, and Kanban exist as text in books. Execution depends on human interpretation, which is inherently inconsistent. Two teams reading the same book implement it in completely different ways. The Build-Measure-Learn cycle degenerates into meetings. The Five Whys become a post-mortem nobody reads. The MVP becomes “the minimum product the manager thought looked nice.” The methodology dies in the gap between what the book says and what the team does.
Deterministic code is the opposite: given the same input, it produces the same output. Always. No interpretation, no “we forgot to run the BML cycle this sprint,” no “we’ll do the Five Whys later.”
| Today (abstract) | Proposal (deterministic) |
|---|---|
| “Run Build-Measure-Learn cycles” | The graph enforces the cycle: can’t advance to Learn without completing Measure |
| ”Use actionable metrics” | The decision node requires a numeric threshold before unlocking the next milestone |
| ”Pivot when the data indicates” | The graph signals automatically when acceptance criteria fail in cascade |
| ”Apply Five Whys” | The dependency traversal executes the Five Whys as a graph query |
The crucial part: the process becomes deterministic, but the decision remains human. The manager still decides whether to pivot. But the moment to decide, the data that supports it, and the record of the decision are all deterministic. There’s no way to “skip” the step.
This isn’t radical. It’s the natural evolution of something that has already happened before.
In the 2000s, manual testing was the norm. Today, nobody takes a project seriously without automated tests. What changed? Tests became code. The discipline of testing left the QA’s head and entered the infrastructure.
In the 2010s, manual deployment was the norm. Today, CI/CD is standard. What changed? Deployment became code. The discipline of delivering left the ops engineer’s head and entered the pipeline.
In the 2020s, project management is still manual. Boards, meetings, spreadsheets. The methodology exists in the manager’s head, not in the infrastructure. And when methodology depends on human discipline, it degenerates. Always.
It’s the same logic as CI/CD: nobody “chooses” to run tests before deploying. The pipeline enforces it. The methodology leaves the PDF and becomes an executable guardrail.
The next natural step is: methodology as deterministic code. Lean Startup, Scrum, Kanban, any management framework, turned into a graph the agent navigates with rules that cannot be ignored. Not as a document nobody reads. As infrastructure that won’t let you skip steps.
mcp-graph is the infrastructure for this. And Lean Startup is the first methodology I’ve tested in this format, but it won’t be the last.
Conclusion: the 2011 book that teaches the future
Eric Ries probably never imagined that 15 years later, someone would read his book and think “this fits perfectly with AI agents.” But it does. Because the principles he described aren’t about startups. They’re about reducing uncertainty in complex environments. And that’s exactly the problem AI agents face when they work without structure.
The insight I had in the bathroom, however prosaic its origin, changed how I think about AI and management. It’s not about using AI to generate code faster. It’s about using AI to execute methodologies with the discipline that humans can’t maintain alone. It’s about transforming proven frameworks into navigable, traceable, auditable infrastructure.
If you lead projects and haven’t read “The Lean Startup” yet, read it. Not for the 2011 hype. For the brutal relevance it has in 2026, when we have tools capable of turning those pages into real execution.
And if you’ve already read it, reread it with the eyes of someone who has an AI agent by their side. You’ll see the book in a completely different way.
I did. In the bathroom. And I’m not the least bit ashamed to admit it.
References and Sources
- Ries, Eric - The Lean Startup: How Today’s Entrepreneurs Use Continuous Innovation to Create Radically Successful Businesses (2011) - Crown Business
- mcp-graph - Open-source tool for structured AI development - github.com/DiegoNogueiraDev/mcp-graph-workflow
- Lean Startup Principles - theleanstartup.com/principles